
I've mentioned a few times in pregame write-ups, that since the Grizzlies are so bad at defense that they need to shoot well to win, and in particular 3-point shooting seems to be essential.
Of course, this issue hasn't gotten past Chris Herrington either. He has been bringing the topic up over and over again in his pre- and post-game analyses. In fact, this is what he wrote after the Warriors game:
The Overwhelming Importance of Three-Point Shooting
I’ve been hammering this all season, but perhaps no game this season has illustrated how much this Grizzlies team depends on three-point shooting than tonight’s did. The Grizzlies shot 9-29 (31%) from three on the game, which isn’t terrible on the surface, but also isn’t generally good enough. On the season, the team is now 5-4 when they hit 10 or more threes, 2-13 when they don’t.And what’s so intimidating is that the Grizzlies don’t just have to be good from three to win. They have to be great. In losses this season, the Grizzlies have shot a respectable 37% as a team on threes, with 36% and 40% shooting, respectively, from Mike Miller and Juan Carlos Navarro. In wins, the team has shot 42% from three with 52% and 42% shooting from Miller and Navarro, respectively. Essentially, the Grizzlies are so bad defensively and, with Gasol either slumping or injured most of the season, so erratic in the post that they have to hit a lot of threes to score enough to win.
I think just about anyone that follows the Grizzlies will agree that this team lives by the 3 and dies by the 3. The biggest stat that jumps out to me is that the Griz are only 2-13 when not hitting 10 or more treys.
This observation caused me to dive a little deeper in an attempt to further back up the claim that Grizzlies success is correlated to 3-point shooting.
Here is the question I am going to investigate here:
What team statistics correlate with Grizzlies success?
To investigate this question, I correlate the Grizzlies eam statistics to point differential, using the game-log stats provided by stats.com. I am using point differential instead of merely win/loss because it lends itself to a statistical analysis better. And also, this post goes great with Chip's recent post about scoring efficiency and be on the lookout for yet another statistical based post by MemphisX on turnovers and points off of them.
What is the Correlation Coefficient?
The correlation coefficient relates the strength and direction of a linear relationship between two variables. The correlation coefficient ranges between -1 and 1. A coefficient of 0 (zero) indicates no correlation. 'Significant' correlation is usually defined to be between 0.5 and 1 (and of course -0.5 and -1). 'Moderate' correlation is usually defined to be between +/-0.3 and +/-0.5. For this exercise I am going to mostly concentrate on any statistical categories that fall into the 'significant' range since our sample size is a bit small.
It should also be noted though that correlation does not imply causation. I am not looking for a cause to why the Griz win or loss games, but rather just what statistical categories tend to correlate best with Grizzlies success.
As well as the correlation coefficient between two sets of data, I calculate the probability of getting the observed correlation by random chance when the true correlation is zero. For this number, the lower the better, and typically below 0.05 is considered improbable, which would then support the hypothesis that the two variables are 'significantly' correlated.
All in all there are many caveats to take into consideration when examining the correlation between two variables, but nonetheless let's move on. I leave the 'be skeptical' lecture to your statistics professor.
Results
I correlated most, if not all, the available team statistics to point differential for the 24 games played this year (that is up through the Golden State game). The usual suspects are there: points, made and attempted shots (FG, FT and 3), percentage for and against, rebounds, assists, turnovers, etc. Below is a table showing the results (correlation coefficient and probability of random chance) for these various categories.

The Obvious: Scoring More Points Helps
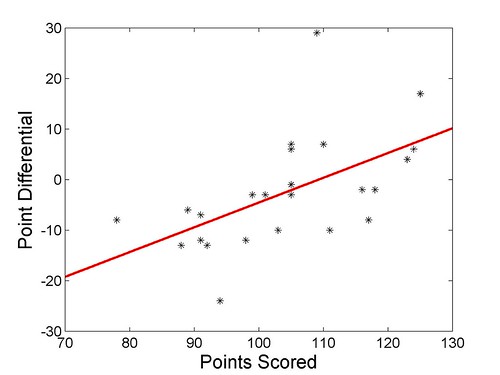
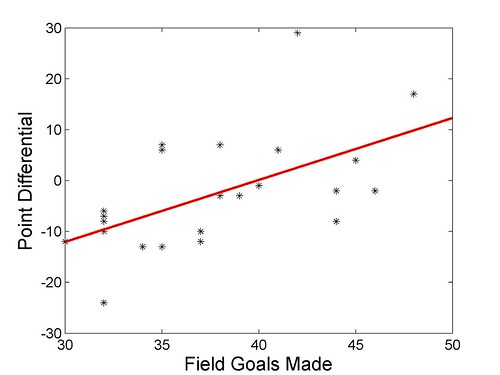
The two obvious categories that show a significant correlation to point differential are points scored and FG's made. Both points scored and FG's made have a correlation coefficient of approximately 0.56.
In short, the Grizzlies win more when the score more. Makes sense and it follows logically from the conventional wisdom that the Griz are always bad on defense, so to be competitive they must score a lot. Notice I said 'be competitive' and not 'win'. That is because I am correlating the game stats with point differential. So, in theory we could not have won a single game, but still show a significant correlation to a certain statistic.
FG%
Not 3-Point Shooting?
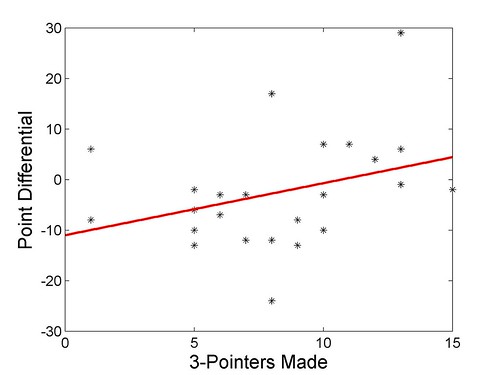
As it turns out, 3-point percentage and 3-pointers made do not show a significant correlation to point differential. 3-point percentage has a correlation coefficient of only 0.23, which is only 'minor' while 3-pointers made shows a 'moderate' correlation at 0.34. I am surprised by this and thought the correlation would be higher. Here is the scatter plot of 3-pointers made versus point differential.
Why Micheal Conley May Make a Big Difference
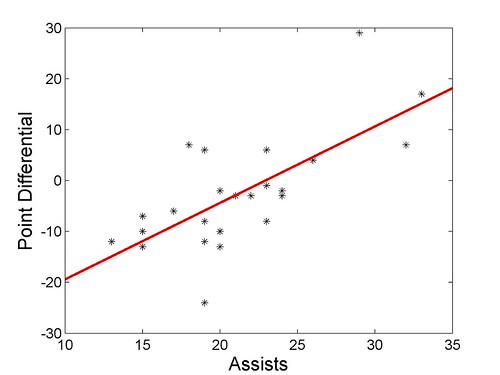
We all know that Conley's best skill is his nifty passing. And as it turns out, the one stat that correlates the best to Grizzlies Success is assists. The correlation coefficient is 0.69 and the probability number shows that it is almost impossible that the result is because of random chance. I also correlated assists-to-FG's made (for you HPTMatt) and assists-to-turnovers to point differential. Both had correlation coefficients in the 0.6 range as well, but not quite as high as just plain assists. Here is the scatter plot of assists versus point differential.
Of course the converse is also true, when the other team has a lot of assists, we are more likely to have a bad point differential (-0.64 correlation coefficient).
Conclusions
Scoring in general seems to be the good indicator of success. Assists seem to be the best indicator of success and might mean more than 3-point shooting does, which wasn't initially what I thought would be the result buts makes perfect sense now. Other categories like rebounds and turnovers didn't show that much of a correlation to point differential, however we all know they also contribute to our success or lack thereof.


1 comment:
I know what I am getting Zack for Christmas!
A copy of the Wages of Wins!!! Dude, you really need to read that book.
Post a Comment